
MAY CONTAIN BAD ASS CONTENT: ANALYST DISCRETION IS ADVISED
Weather Based Marketing with Alteryx and Snowflake
Getting Started:

Pre-requisites
To proceed from here, you will need to have the following:
1) Alteryx designer --> Free trial here
2) Snowflake account --> Free trial here
3) Setup Alteryx for data exchange --> post here
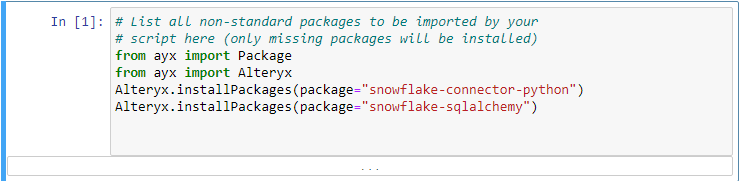
4) Request the following data sets in the Snowflake data exchange --> Global retail data, weather sample set (Search www.demanddata.io or email us for links!)
How it all works
Connect to the weather sample set in Alteryx, and the first step is to get an overview of all of the weather stations that are available. You can do this with a group by station id, latitude, longitude and stream that into Alteryx. This allows us to bring a minimal amount of data into our local environment. You can do the same with your locations of interest- these can be anything with a lat/long pair (or do some Geocoding --> future post on this soon!). Make sure you put some point tools on your coordinates to turn them into spatial objects and then use a find nearest tool to map all your locations to a weather station. Then, use a summarize tool or a unique tool to get back unique weather stations. What we have effectively done here is mapped all our locations of interests (our stores, our customers, our suppliers etc) to a weather station. We can put in some confidence limits around how far away a station is but I've found in the US a 20 mile radius captures most of the population. (Of course we could use Alteryx to PRECISELY calculate this number)!
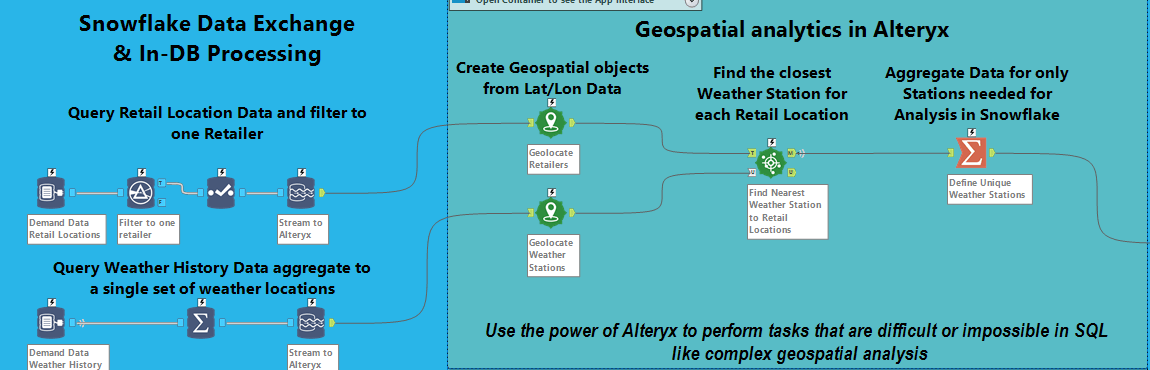
Now that this is done, we can push the relevant weather stations back to Snowflake with a data stream in tool. Here we use a temporary table and join back to our main weather day. Effectively, we have done a nice little geospatial filter in Snowflake with just 3 tools in Alteryx! We have also effectively mapped all of our locations of interest to a weather node (on which we have history and a live forecast through Snowflakes data exchange). From here we have some options- we can get our weather history and do some modelling (in a later post we will show how to use weather history to improve sales forecasting), but for our first introduction to this topic, we are going to work only with the forecast. Our data set contains a json file with the next 15 days of forecasts.
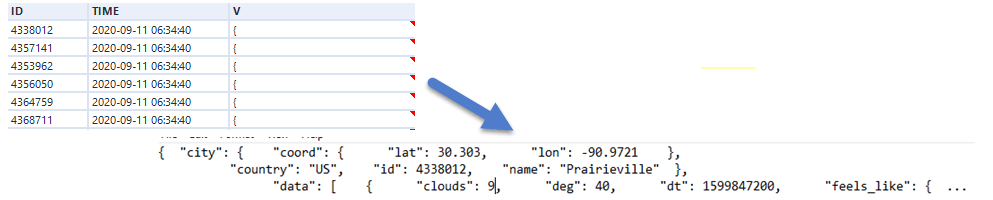
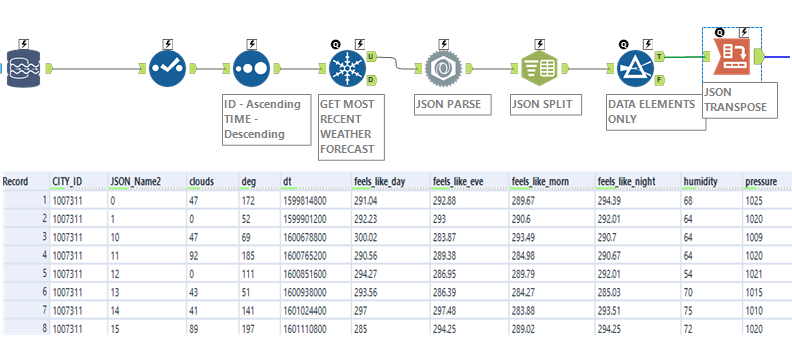
Now again back to options- if you are good with SQL, you can use the flatten functions within Snowflake to flatten all this data out, however, I, personally, find it much easier to do with Alteryx and the json parse capabilities which make unpacking and figuring out this data fairly painless. If going the Alteryx route, you need a json parse tool to bring all the elements out, then a text parse tool to expand out fields. Then you can use a cross tab tool to pivot all your elements and fields into a more manageable flattened structure. By sorting based on our forecast date and using a unique tool, we bring in the latest forecast only for each city or weather station id.
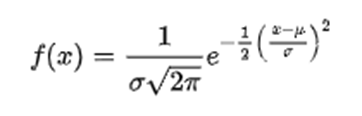
Now, we just need to deal with the conversions in the different fields. In this dataset, temperature is all based in degrees Kelvin. For those of you who forgot your primary school chemistry, Kelvin is just Celsius re-based to absolute zero. It's quite a simple formula to convert, just subtract 273.15. (Why 273.15? You are going to have to talk to a physics PhD for that one, I'm afraid). For the Americans who adopted Fahrenheit with its easy to remember numbers like freezing water at 32 and boiling water at 212, that conversion is just multiply by 9/5 and add 32. Finally, time; all the coders will recognize the time field as unix time, but for the rest of us, it's just the number of seconds that have occurred since the epoch (really the beginning of time for computers) which at some point was arbitrarily decided at Jan 1st, 1970. Apparently, the 60's didn't really exist (for unix developers anyway). A nifty Alteryx trick here is to use the multi-field formula, so you can apply the same temperature formulas to many fields at once.
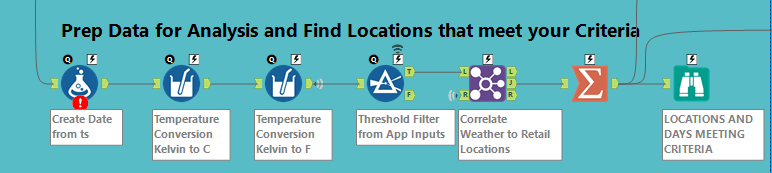
Now that we have all the weather stations that are close to our locations of interest, all that is left to do is bring back the metadata about our locations. As a note here, we will likely have multiple locations for the same weather conditions but that is to be expected. You may have 100 locations in central London for example, which may all be mapped to a single weather condition station. From here, you can see the forecast against all of your locations of interest, or you can take it up a notch and make this dynamic with a few analytic app anchors. In this case, we have taken all of the different fields and mapped them to allow a user to select locations that fit certain weather criteria.
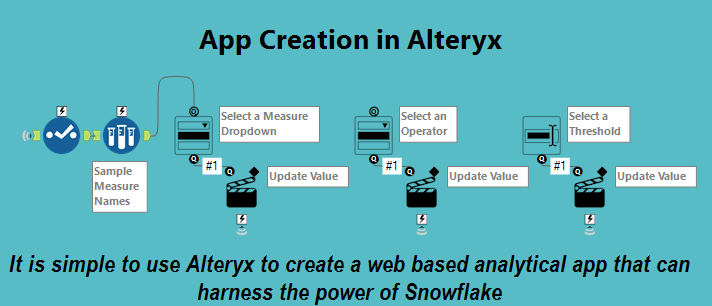
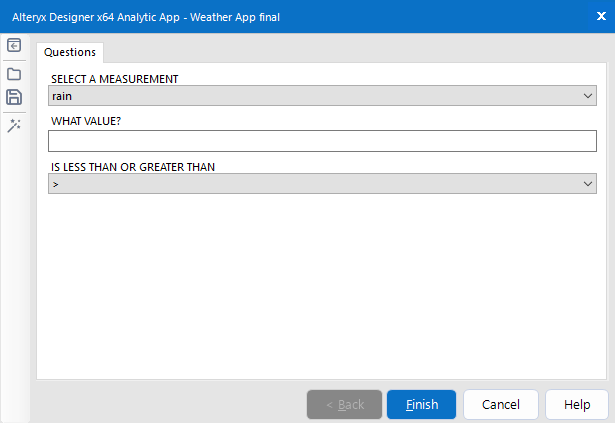
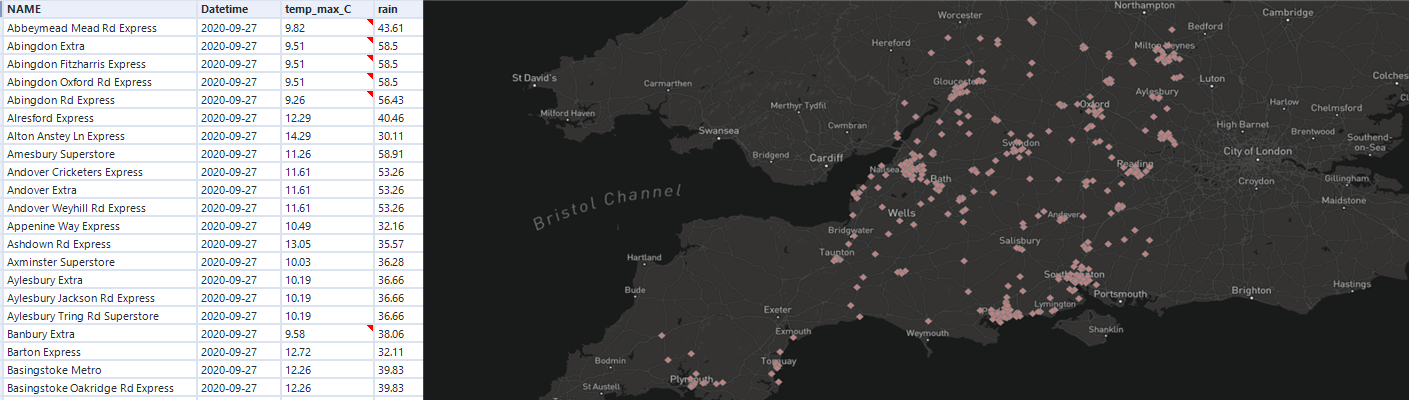
So what these means is you can establish a user based criteria for rain or drought, hot or cold, windy or calm, clear or cloudy and run this app to produce all the locations of interest that meet this certain criteria at some point in the next 14 days. We have hooked this up to a simple report tool and for example, shown all the Tesco stores in the UK that are expected to get 30mm of rain on any given day. Bad news in the southwest UK towards the end of September.
So from here - it is really up to you to think creatively about how this type of automated data can be used to drive your business. With the weather history we mentioned earlier maybe you have used machine learning to predict which products sell well on hot and sunny days, or that consumers who are stuck indoors on rainy days use your service or visit your locations more. Then its just a question of creating live predictions of when these conditions will exist so that you can ensure your inventory is adequately stocked, or your store is adequately staffed or that you are positioning your product online at just the right moment. The Alteryx APA platform can make all of this possible with easy integrations. Increase target stock or target staffing at locations in your ERP systems - no problem. Create a custom Facebook territory and upload it directly into Facebook audience manager (easy). Send a custom email campaign with the perfect product for the upcoming weekend - just join on postcode and create custom campaign audiences for your marketing teams. So umbrella salespeople in Southampton - be ready :)