
DYNAMIC DEMAND FORECASTING

TRY UNIVARIATE FORECASTING NOW
In order to view dynamic forecasting in action, create a csv of your data that contains at least the following two columns. (DATE, VALUE). Date must be in timestamp format. (YYYY-MM-DD)
OR
Try some of our samples.
SAMPLE DATA <-- Daily female births in California in 1959.
(Recommended Parameters -> Monthly Data, 30 days withholding, 60 day display)
SAMPLE DATA <-- Average weekly temperature for Melbourne, Australia from 1980 - 1990
(Recommended Parameters -> Weekly Data, 24 weeks withholding, 48 weeks display)
SAMPLE DATA <-- Monthly sales of a major Shampoo brand from 1991 - 1993
(Recommended Parameters -> Monthly Data 0 months withholding, 6 months display)
To use our self-service tool:
- Upload the data file.
- Select the data granularity, the amount of data to withhold for testing and the number of periods to view in your chart.
In the background, Alteryx will prepare the data and run it with an ETS and ARIMA model and return the model actuals and forecasted values.
THE PROCESS EXPLAINED
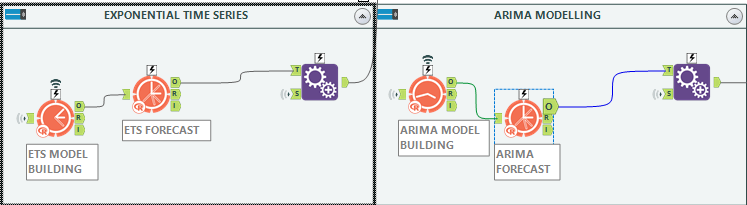
Alteryx is prepping your time series data and running it through 2 simple time-series algorithms. One is ETS (Exponential Time Series) and the other is ARIMA (auto-regressive integrated moving average). These tools are available with the download of the predictive tool packs included with your Alteryx designer license. Our workflow will also calculate MAPE (Mean absolute percentage error) which is a simple, standard methodology for calculating forecast error. This simply takes the total error between each forecasted and observed value and averages each error over the entire predicted period. Generally a MAPE of 10% or less is considered to be very good for a forecast, while MAPE's that exceed 40% are generally regarded as poor forecasts. This is of course highly variable depending on your application
UNIVARIATE VS MULTIVARIATE FORECASTING
Arima and ETS single variant forecasting can be acceptable for very simple models. However if you are unhappy with accuracy of your output, a multi-variant approach might be needed. Multi-variant forecasting takes into consideration multiple variables and the impact these have on your forecast. These include things like weather, promotions, holidays, competitor information, stock prices, economic indicators and many more. With TIM Instant ML from tangent works, Demand Data can run your data against a multitude of publically available variables to develop much more accuracy forecasts. If you want a complete forecasting assessment, contact us, or upload a sample data set in the box on the left and we will contact you to discuss your data and the potential impact of other variables on your forecasts. For details on TIM visit our blog our partner tangent.works.
New Paragraph