MAY CONTAIN BAD ASS CONTENT: ANALYST DISCRETION IS ADVISED
In Supply Chain, Maths is cool again
Why use maths?
- Cloud Computing is enabling supply chain professionals to perform more math, faster.
- Cheap Storage is providing the ability to store more data about products and environmental variables which gives more fuel for the math to solve.
Maths solve variables. Variables = Risk = Cost
One of my very first managers simplified this in one of my first meetings about supply chain design as an Intern at American Home Products (now many mergers later – part of Pfizer). He said “If I know what supply I am getting today, and I know exactly what I am selling tomorrow, my inventory should be zero”.
Now, we all know that is unfortunately not the case – and all companies in the supply chain inevitably end up with inventory. However, unpacking that statement a little further all he was saying was that inventory is a buffer for variability (also known as risk). We need inventory because we don’t know what we are going to get today (supply), and we certainly don’t know what we are going to sell tomorrow (demand). It's really all a constant balance between supply and demand. On the supply side, we use inventory to create some buffer and on the demand side we can manage service expectations and line fill rate.
Less data = more cost
In the pharmaceutical industry – where I learned the supply chain trade, there were often some very high consequences for not having enough stock, ranging from lost sales on very high margin products to adversely affecting human health. When I was doing planning, we were reliant on supply chain segmentation – usually we classified products as A, B or C based on their importance to the company and/or society. In other words – never run out of an A product...ever. B products - bad news but survivable. C products - just get it back in stock quickly. What struck me was how much excess inventory was always piled on to A products, even products that had years of history showing stable demand and stable supply. The lack of data and inability to process it just meant products got grouped with inventory and safety policies into 3 categories - even across 100s or 1000s of products. This may have worked (at times) but it failed to take into account that inventory equals
cost. Having more than you need costs your business something, either through obsolescence risk, cost of capital, cost of storage or cost of capacity. Now sometimes that cost is justified,
but often it is not. However,
the good news is that this can be solved for.
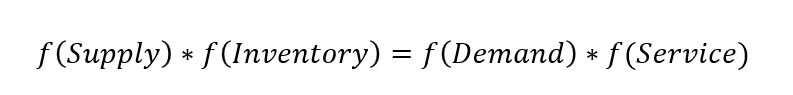
The inventory, supply, demand, service relationship
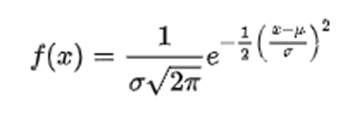
Our equation above is a more complex version of the first equation. It is the cumulative distribution function for a normally distributed equation and models random demand variability fairly well. σ is your variability (how good your forecast is) and x is expected deviation from a forecast and f(x) is the probability of that deviation happening. To simplify = if you know your variability, you can precisely determine the probability of having a certain amount of stock in the future.
This means if you wanted to ensure that your service level was 98%, and you can model your supply and demand with a variability of σ, we can say exactly how much inventory is needed. This also means that if we reduce variability, we can reduce inventory and get the same service level. Solving these kinds of equations can be quite difficult by hand, but they are pretty easy for computers and can be solved with a few lines of code at an impressive speed and scale.
Forget A,B,C segments - segment everything
What this means is the idea of having supply chain segments is changing. We don’t need to classify items into A, B, C categories anymore. In fact, one can calculate target inventory for every item in your organization, at every step in the supply chain…..independently. All you need to know is how much variability there is in supply and in demand and what availability you are comfortable with. The math will take care of the rest.
Get Variability down
A common saying I have heard throughout my career (in supply chain and otherwise) is: You don’t know what you don’t know. This is very true, but it is best to start with what you do know. This means build out your demand forecasts with as much data as you can. There are tools which can take this data and use it to lower your variability by training demand forecasting algorithms across vast numbers of iterations and combinations of factors. This enables the deconstruction of even the most seemingly random events into mathematically solvable equations with increasingly small degrees of error.
On the demand side, things like:
- Seasonality and hyper-seasonality (yearly and weekly or even daily trends)
- Events (promotions, holidays, advertising)
- External Factors (weather, traffic, competitor activity)
On the supply side things like:
- Failure rates
- Shipping lanes
- Frequency of production
By modeling what has happened in the past and overlaying what you know about the future (Christmas does happen every year and around the same time :), we can start to apply what we know to our expectations - which lowers our overall variability.
Whats next?

Demand Data has partnered with Tangent Works, a leading machine learning time-series company. We are busy working with a number of CPG and retail companies to take all their data and leverage Tangent Works' TIM engine to create a new breed of time-series forecasts (either demand or supply) that go beyond traditional statistical methods to incorporate the features of each product and link in your supply chain. The results are improved forecast accuracy but most importantly forecasts that are modeled for each unique aspect in your supply chain. Over the coming weeks, we will show you how to use the TIM engine to lower your variability and how to do it at speed, which will overcome another one of life's great variables....time.
By James Smith - Demand Data